
Application Monitoring is a critical aspect of today’s digital environment. Whether you’re running a large-scale e-commerce platform, a dynamic news portal, or a simple blog, ensuring your application’s optimal performance is paramount to delivering a seamless user experience.
The reliability of your applications is absolutely critical to the continuous operation of your business. Any downtime or disruption, especially in applications integral to your sales delivery process such as web applications, can be catastrophic.
Each moment of unavailability directly translates to missed revenue opportunities. In the digital business landscape, uptime isn’t just a technical concern; it’s a direct contributor to your bottom line.
In this article I want to introduce you to the importance and purpose of application monitoring, with a focus on its two key benefits: proactively addressing performance issues and understanding system dependencies.
Gain insights on how you can leverage application monitoring to enhance your application’s performance, user satisfaction, and ultimately, your business’s success.
Check out our Top 4 best application monitoring systems
There’s no point in listing 10 or 12 app monitoring systems, when there is only 4 that we truly like and recommend. If you want to read more on each of them, we go more in depth later in this article.
#1 – AppOptrics (Free Trial for 30 Days)
#2 – ManageEngine App Manager (Get your 30 Day Free Trail Here)
#3 – Datadog AMP
#4 – Site 24/7
The Purpose of Application Management Monitoring
Application monitoring serves as a strategic tool that provides insight into an application’s performance, reliability, and user experience. Its main purposes include:
- Identifying and Resolving Performance Issues: Through application monitoring, IT teams can identify and troubleshoot performance bottlenecks. This helps in maintaining optimal application performance and preventing issues that could potentially disrupt business operations.
- Understanding System Dependencies: Every application is interlinked with various components and systems, such as databases, servers, and third-party services. Application monitoring helps to understand these dependencies and how they impact application performance.
- Ensuring Availability: By tracking an application’s uptime, teams can make sure that their services are always available to end-users, thereby providing a consistent user experience.
- Informing Business Decisions: The data derived from application monitoring can be used to make informed decisions on infrastructure investments, resource allocation, and strategic planning.
What exactly is APM?
Application monitoring, often referred to as Application Performance Monitoring (APM), is a process that involves tracking and managing the performance and availability of software applications. It’s all about ensuring your applications are performing as expected and providing a high-quality user experience.
By using application monitoring tools, you can gather performance metrics like response time, request rate, and error rate, enabling you to identify any performance bottlenecks or issues. This information is vital for troubleshooting problems, understanding user experience, and making informed decisions to enhance application performance and reliability.
In essence, application monitoring keeps your digital operations running smoothly and efficiently, ensuring maximum uptime and optimal user satisfaction.
Best Application Monitoring Systems on The Market
Here’s our small list of what we think are the best players in the market when it comes to App Monitoring.
We don’t just pick any old application monitoring system at random to make up a “best of” list. Nor do we choose who comes top in Google results.
How We Decide on the Best Application Monitoring Systems
We follow the following criteria to really get an understanding of what is classed as a good product or service within the application monitoring systems market.
- Ease of Use: The system should have a user-friendly interface that allows for easy setup and use. You should be able to easily navigate through the system, view reports, set up alerts, and more.
- Customization: Different applications have different monitoring needs. The system should allow you to customize what you monitor based on your unique application infrastructure and business requirements.
- Integration Capabilities: The monitoring system should easily integrate with the other tools and systems you’re using. This could include your development tools, ticketing systems, communication platforms, and more.
- Alerting and Reporting: Look for a system that provides real-time alerts when issues occur, along with detailed reports to help you analyze trends and identify areas for improvement.
- Scalability: As your application and user base grow, your monitoring needs will also expand. The system should be able to scale with you and handle an increase in data volume and complexity.
- Proactive Monitoring: The system should not only notify you of issues after they occur but also help you identify potential problems before they impact your application’s performance.
- Support for Multiple Environments: If your application runs in different environments (such as on-premises, cloud, or hybrid), the system should be able to monitor all these environments effectively.
- Cost-effectiveness: Consider the pricing structure of the system. Ensure it fits within your budget and offers a good return on investment.
- Security: The system should adhere to best practices in data security and privacy. It should offer features like encryption and should comply with relevant regulations.
- Vendor Support: Good vendor support can make a significant difference. Look for vendors who offer comprehensive support, both during implementation and afterward.
- Free Trial Period: A free trial period allows you to test out the system before committing to a purchase. It gives you the opportunity to evaluate its features, understand its interface, and see how well it fits into your application environment.
Considering these selection guidelines, we’ve pinpointed top-tier application monitoring services that stay abreast of cutting-edge technology and offer proactive alerts to prevent potential crises.
#1 – AppOptrics (Free Trial)
AppOptics by SolarWinds is a comprehensive application performance and infrastructure monitoring tool designed for businesses of all sizes. The product offers an integrated view of your applications’ performance and infrastructure metrics, enabling efficient troubleshooting and optimization.
AppOptics supports a wide variety of applications, infrastructure, and cloud services, offering robust monitoring capabilities. It provides IT professionals with the ability to identify and resolve performance issues quickly, ensuring optimal user experience and business continuity.
The trusted APM tools support multiple languages, including Java, scala, .net, pho, python, node, and many more.
Key Features:
- Application Performance Monitoring (APM): AppOptics provides detailed performance insights for a broad range of applications. It includes tracing capabilities to identify and resolve performance issues quickly.
- Infrastructure Monitoring: It offers robust infrastructure monitoring capabilities, providing visibility into servers, databases, and other critical IT assets.
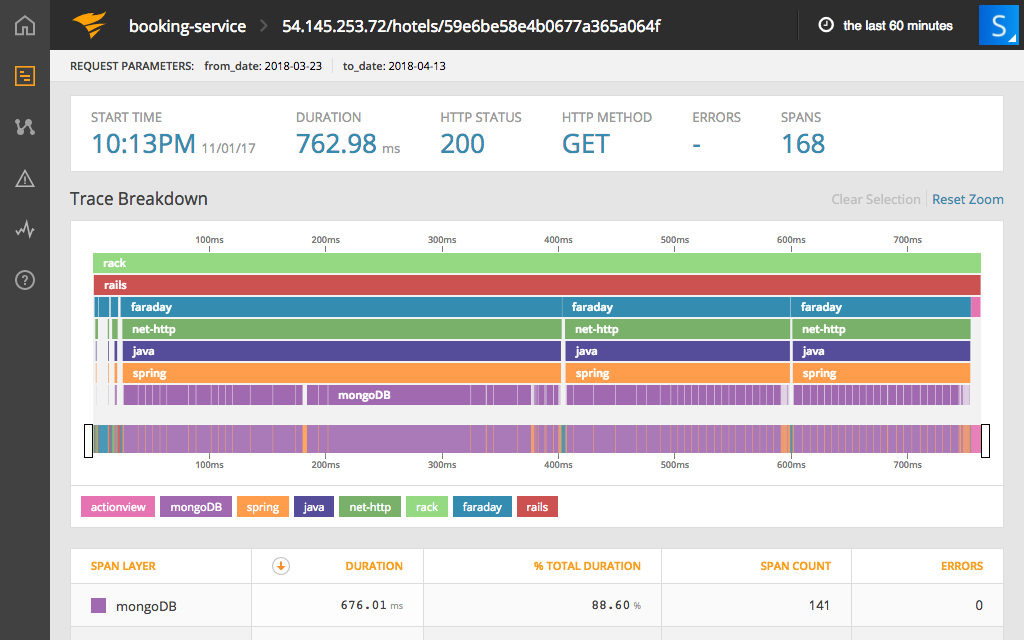
- Distributed Transaction Tracing: AppOptics offers detailed, end-to-end distributed transaction tracing, making it easier to understand complex system interactions and identify bottlenecks.
- Cloud Monitoring: It supports a variety of cloud services, providing a unified view of your application and infrastructure performance across different environments.
- Alerting and Notifications: AppOptics allows you to set up custom alerts based on a variety of conditions, ensuring that you are promptly notified of any potential issues.
- Integrations: AppOptics can be integrated with other SolarWinds products and a variety of third-party tools, providing a comprehensive monitoring solution for your IT environment.
- Dashboard and Reporting: It offers customizable dashboards and reports to help you visualize and understand your data, aiding in trend analysis and informed decision-making.
What We Love About AppOptrics
Our top choice for application monitoring is AppOptics, primarily due to its comprehensive tracking capabilities. As applications execute, it not only identifies all associated modules, services, and resources, but also monitors their activities in detail.
For web applications, AppOptics can scrutinize the code, highlighting each line as it is encountered during runtime. If an issue emerges, it pinpoints the exact line within a function causing the problem. The dependency map further enhances the tool’s efficacy, as it allows instant visibility into involved resources, thus hastening resolution time.
Additionally, its alerting feature assures you that things are running smoothly, freeing you to focus on other tasks, safe in the knowledge that you will be promptly notified if any problem occurs.
#2 – ManageEngine Applications Manager (Free Trial)
ManageEngine Applications Manager is an application performance monitoring tool that helps businesses ensure their mission-critical applications and servers are up and running at peak performance. It supports over 130 applications and infrastructure technologies, helping businesses to improve their application performance, troubleshoot issues rapidly, and plan capacity in a more informed manner.
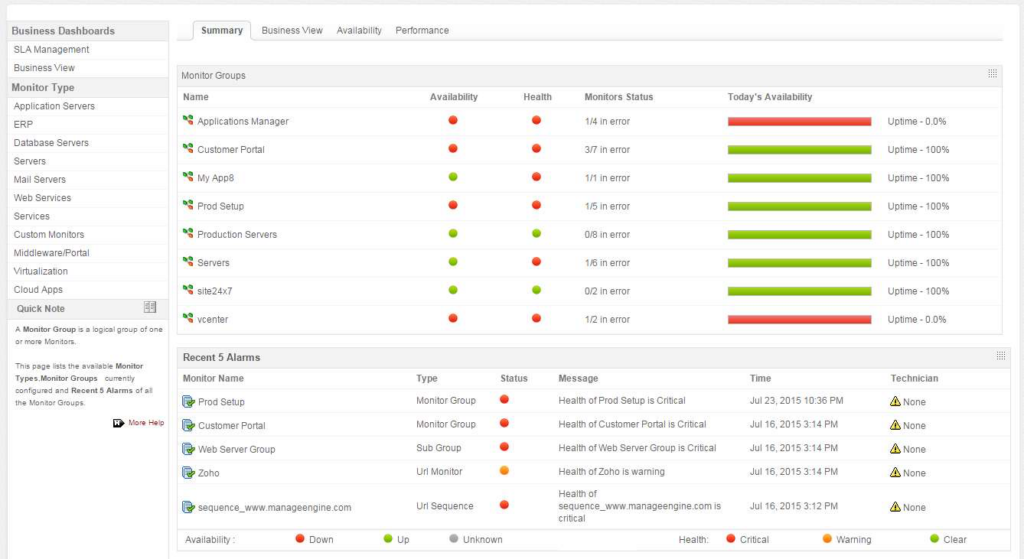
ManageEngine Applications Manager offers a single, comprehensive console that allows IT admins to monitor, troubleshoot, and analyze data from their applications and IT infrastructure. It provides deep-dive diagnostics, enabling proactive monitoring and rapid troubleshooting of issues for a wide range of applications, databases, servers, services, and more.
Key Features:
- Application Performance Monitoring: Monitor performance, availability, and usage of a wide range of applications and servers, including web applications, databases, ERP suites, virtual systems, cloud services, and more.
- Deep-Dive Diagnostics: Provides in-depth insights into application performance issues, helping to identify and resolve problems quickly.
- End-User Monitoring: Tracks end-user experience and provides insights on application performance from the user’s perspective.
- Capacity Planning: Helps predict growth and usage trends, aiding in better capacity planning and infrastructure investment decisions.
- Automated Actions and Alerting: Provides real-time alerts and automated actions, such as sending an email or executing a script when a monitored parameter exceeds a set threshold.
- Reporting and Analytics: Offers detailed reports and visual representations of data, helping in trend analysis and informed decision-making.
- Integration Capabilities: Can be integrated with other ManageEngine products and third-party tools, offering a unified IT management solution.
ManageEngine Applications Manager comes in three versions, catering to various needs. The first, a Free version, is suitable for basic needs, providing monitoring for up to five resources.
The Professional version, the starting point for the paid offering, extends this capability further. For larger corporations with extensive requirements, the Enterprise version offers even more comprehensive capacity. All three versions can operate on either Windows Server or Linux, with the flexibility to access the system as a service on cloud platforms like AWS or Azure.
They also offer a 30-day free trial for the Professional or Enterprise versions, which you’d be mad not to sign up to!.
At the end of the trial, if you decide its not for you, your software will automatically revert to the Free version of Applications Manager.
#3 – Datadog APM
Datadog APM (Application Performance Monitoring) is a robust monitoring solution that provides in-depth visibility into your applications. It is specifically designed to monitor, troubleshoot, and optimize application performance in real-time, regardless of the complexity of your infrastructure.
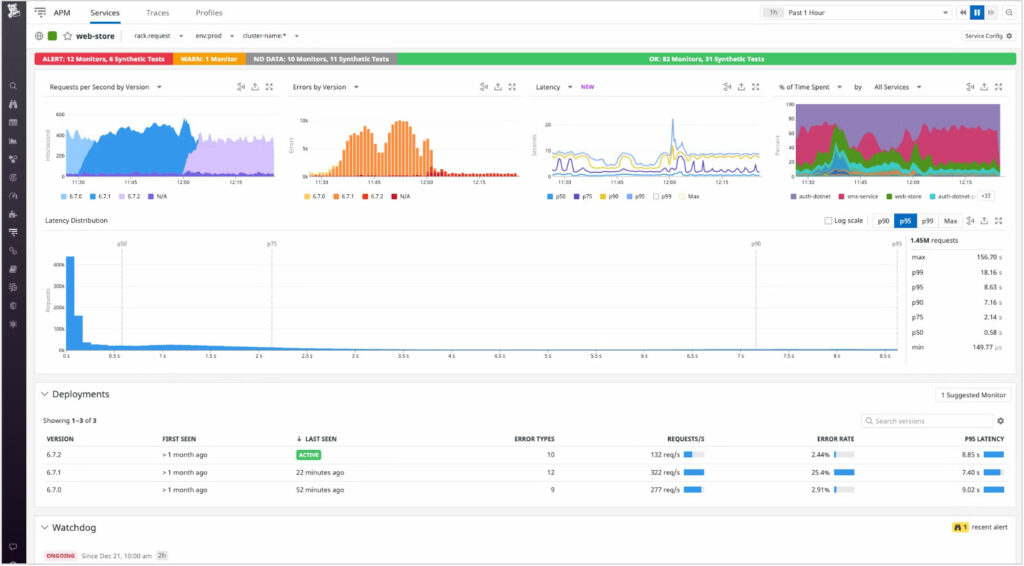
Datadog APM allows you to trace requests from end to end across distributed systems, allowing your operations and development teams to observe service dependencies, understand latency bottlenecks, and troubleshoot performance issues.
Key Features:
- End-to-End Request Tracing: Datadog APM allows you to track requests as they travel across various services in your environment. This helps in identifying performance bottlenecks and understanding the impact of individual services on overall application performance.
- Detailed Performance Insights: Provides in-depth insights into application performance, with metrics like latency, throughput, and error rate for each service and endpoint.
- Real-time Visualization: Offers real-time dashboards to visualize your application performance data, helping you quickly identify patterns and anomalies.
- Automated Alerting: You can set up automated alerts based on various performance metrics, ensuring that you’re quickly notified of any potential issues.
- Integration with Datadog Platform: Datadog APM integrates seamlessly with the rest of the Datadog platform, including log management, infrastructure monitoring, and synthetic monitoring features, providing a unified view of your entire tech stack.
- Support for Various Languages and Frameworks: Datadog APM supports a wide variety of programming languages and frameworks, ensuring that you can monitor all components of your application.
- Distributed Tracing with Flame Graphs: Flame graphs provide a visualization of how resources are being consumed by your application, helping you identify which parts of your application are slowing down the user experience.
#4 – Site24x7
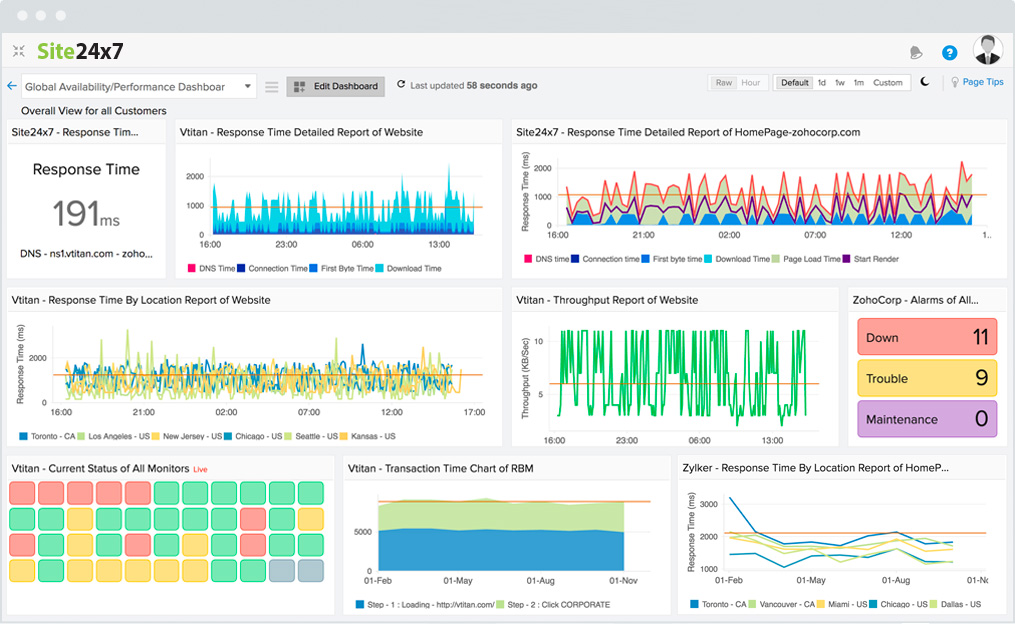
Site24x7 is an all-in-one monitoring solution that provides insight into the performance of websites, online applications, servers, mobile websites, and cloud platforms. It’s designed to help businesses ensure their critical services are always available and performing at optimal levels.
Site24x7 delivers a unified solution for monitoring applications, infrastructure, and user experience, enabling businesses to maintain superior digital experiences and minimize downtime.
Key Features:
- Website Monitoring: Site24x7 allows you to monitor website availability and performance, ensuring that your sites are always up and running and providing a seamless user experience.
- Application Performance Monitoring (APM): Offers deep-dive application monitoring to track and optimize your application performance, from server health to database queries, all in real-time.
- Server Monitoring: Provides comprehensive server monitoring capabilities, covering various server types and parameters to ensure high availability and performance.
- Real User Monitoring (RUM): Allows you to understand your users’ experience by tracking and analyzing how they interact with your websites and applications.
- Cloud Monitoring: Provides visibility into the performance of cloud services, helping you maintain optimal performance and availability of your cloud resources.
- Alerting and Reports: Offers customizable alerts and detailed reports, enabling you to stay updated on your system’s status and make data-driven decisions.
- Synthetic Web Transaction Monitoring: Helps you automate the monitoring of multi-step interactions on your website or web application to ensure important workflows, like login or checkout processes, are functioning as expected.
The 3 Different Types of APM Tools
Let’s take a look at the three different types of Application Performance Management (APM) tools.
Application Metrics-based APM Tools
Application Metrics-based APM tools focus on tracking and analyzing performance data from your application. These tools gather a wide range of metrics like response time, request rate, error rate, and more to provide a holistic view of your application’s performance. They enable you to understand how your application behaves under different loads and how its performance evolves over time. By continuously monitoring these metrics, you can quickly identify any performance issues or bottlenecks and take corrective actions. These tools are generally used by operations teams to ensure application availability and optimal performance.
Code Profiling-based APM Tools
Code Profiling-based APM tools take a deeper dive into your application’s performance by analyzing your application’s code execution in real-time. They can identify which methods or operations in your code are consuming the most resources or causing performance issues. This type of APM tool is extremely valuable during the development and testing stages of an application, helping developers identify and optimize inefficient code. By providing insights at the code level, these tools enable developers to understand precisely where bottlenecks occur and how to fix them.
Network-based APM Tools
Network-based APM tools, as the name suggests, concentrate on the network aspects of application performance. They monitor and analyze network traffic between users and applications, as well as between different application components. These tools can help you identify issues like network latency, packet loss, or bandwidth usage that might be affecting your application’s performance. By providing visibility into your network performance, these tools can help ensure that your network infrastructure is not a bottleneck for your application performance. They are especially useful in distributed architectures, where applications rely heavily on network communication.
6 Application Monitoring Best Practices
Start with the End User in Mind:
It’s vital to always keep your user at the forefront of your thinking. After all, their experience is what matters most. So, make sure your monitoring activities are focused on ensuring optimal user experience.
Establish Clear Goals:
Just like in any other aspect of business, you need to know what you’re aiming for. Are you trying to improve load times? Or maybe you’re looking to reduce error rates? Having clear goals will help you prioritize your monitoring efforts.
Cover All Bases:
An application is a lot more than just its front-end, visible elements. It’s also about the back-end services, APIs, databases, and more. Make sure your monitoring covers all these components to get a complete picture of your application’s health.
Be Proactive, Not Reactive:
Don’t wait for issues to become visible before you take action. Use predictive analytics and set up alerts to identify potential problems before they impact your users.
Document and Communicate:
Make sure your findings from application monitoring are clearly documented and communicated to all relevant stakeholders. This can be your development team, your management, or even your users (if applicable).
Learn and Adapt:
Use the insights from your monitoring activities to continually improve your application. This could mean fixing bugs, improving performance, or even identifying opportunities for new features.


